CHAPTER
SEVEN: PROBLEMS
The Town of Branford, like so many urban/suburban areas has a number
of environment problems associated with human activity. These problems
are typically the result of poor land planning practices of the
past and inadequate disposal of wastes. Although much of the Town
has escaped some of the worst problems we have seen in suburban
areas, there are still a number of problems that have the potential
to cause harm to the humans, plants and other animals that live
here. The information presented below is based solely on those problems
that are listed with the Town, State or Federal governments. Budget
constraints did not allow for additional surveys or assessments.
As a result, this database is far from complete and it is recommended
that the Town commit resources in the future to properly document
the extent of environmental problems within its borders.
Landfills
The Branford landfill is located at the end of Marshall Road (located
off Tabor Drive) approximately 2000 ft. north of Long Island Sound.
The landfill covers a total area of approximately 28.5 acres and
includes two disposal areas; a solid waste disposal site that covers
about 10.2 acres and includes an older solid waste landfill located
on the ZuWalick property, and a bulky and special waste disposal
site to the east that covers approximately 18.4 acres. Much of the
landfill stopped receiving materials during the mid to late 1990's
and only a small portion of the eastern tract currently receives
bulky waste and special wastes as approved by the DEP.
The remainder of the site is now being prepared for final closure
activities. By 2000, closure had progressed to mixing and grading
work. This year it is anticipated that almost 15,000 cubic yards
of clean soil will be added to the top to form an 18-inch cap for
the nearly 6 acres of area. The top and the sides will be stabilized
with grasses, and erosion rills will be fixed throughout the landfill.
Due to problems with potential groundwater contamination, homes
in the area were hooked up to public water supplies during the late
1980s. Since that time, no domestic water supplies were coming from
the aquifer so water-monitoring plans needed only to report on ground
and surface water testing. A monitoring plan for the landfill was
established during the mid 1980's. Six groundwater monitoring wells,
three surface water sampling stations and four methane gas ports
were established to document any pollution the landfill may cause.
During the late 1980's, two plumes of leachate (materials from the
landfill) were noted heading outward from the landfill: a larger
one that includes the ZuWalick property that is heading in a west
to southwest direction towards Sybil Creek and a much smaller one
that is moving slowly to the east.
Sampling conducted in 1985 showed that all of the wells had elevated
levels of ammonia, nitrogen, chlorides and suspended solids. In
1987, monitoring was expanded to include volatile organic compounds
(VOCs) such as xylene, toluene and benzene, compounds common to
landfill leachate. Although these compounds can be a problem to
living organisms, they were not found to be in concentrations sufficient
to cause significant harm to the environment. However, there were
instances where the presence of certain compounds did exceed National
Primary and Secondary Drinking Water Standards (i.e., dissolvable
manganese, dissolved solids, ammonia). Thus, in 1989, the State
issued a directive (Consent Order #WC4869, August 21, 1989) to connect
all residents in the area to public water.
Well monitoring has continued through to the present (Fuss and O'Neill,
Inc. Consulting Engineers, 146 Hartford Road, Manchester, CT 06040).
As of 2000 (reported in 2001), there were few changes in the concentrations
of chemicals in the groundwater and the plume moved slightly west
of its 1999 position. A comparison between 1987 and 2000 shows that,
for the most part, there has been no increase in any of the leachates
to the groundwater and, in a few instances, some chemicals even
dropped in the monitoring wells (i.e., 1,4 -- dichlorobenzene).
Some of the changes to the plume in recent years include a decrease
in ammonia and an increase in chlorides, the later probably the
result of brackish water intrusion rather than leaching from the
landfill. One VOC, chlorobenzene, exceeded State of Connecticut
Dept. of Health Services Maximum Contaminant Level (MCL) in all
monitoring events (100 -- 170 mg/L; the MCL is 100 mg/L). The plume
continues its movement down-gradient, but at a relatively slow pace.
Since no drinking water is taken from the ground, no further remediation
is required. Surface waters show little impact from the landfill
except higher chloride and sodium concentrations, again most likely
the result of saline water intrusion rather than a problem with
the landfill itself.
There is another landfill located in the western portion of Town
that was used by the DOT for construction debris and road material.
This site has been inactive for a number of years and little information
about the site is available.
Septic and Sewer Systems
At present, a significant portion of the residential areas in Town
are served by the sewer treatment system (Figure
14: Point & Non-point Source Pollution, shaded area on map).
The areas remaining that are not served include much of the east
and portions of the central and north central sections of Town.
Those areas not served by the sewage treatment system are the least
densely developed parts of Town and are served by individual septic
systems. The septic systems are designed to remove solids and nitrogen
wastes from household water through filtering in the soil over a
specified period of time and rate. The design of the system and
its capacity is a function of the soils underlying the septic system
(i.e., percolation rates). Each system must be designed specifically
for the waste stream it is intended to treat. These systems can
function efficiently if they are maintained properly (i.e., proper
cleanouts, working pipes).
The type and location of septic systems are not maintained as a
list by the health department. Since it would be impractical to
list the systems file by file for this report (time and money would
not allow for such an accounting), refer to the Problems Map for
an indication of where septic systems are located (areas not shaded
in purple). For more specific information contact the East Shore
District Health Department at (203)481-4233 (see contact information
in Appendix V: Contact Information).
The Sewage Treatment plant is presently undergoing a significant
upgrade in its facilities. Part of the upgrade is to handle more
capacity and the other part of the upgrade is to improve nitrogen
removal. The plant will be upgraded to handle a maximum capacity
of 6.9 million gallons, up from the 4.2 million gallon capacity
it can now handle. Another upgrade to the system will include denitrification
of the treated water to a maximum of 5 mg/L nitrogen in the discharge
to Branford Harbor and LIS. The additions and changes to the treatment
plant include a new pretreatment building, new primary settling
tanks, secondary clarifiers and processing building and the addition
of a new truck loading building that will greatly reduce many of
the odors associated with the plant. The application process is
still on-going but is expected to be complete within the next few
months. Work on the treatment plant is expected to continue through
2003.
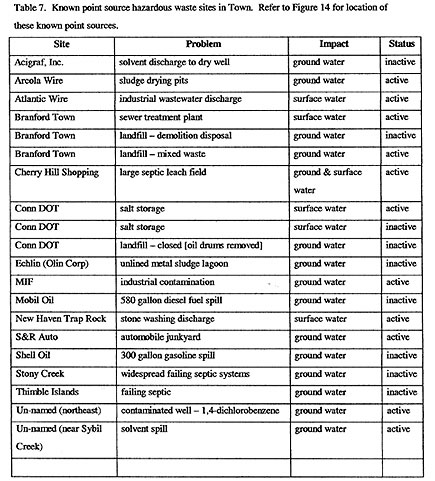
Hazardous Waste Sites
Although there are probably many smaller hazardous waste sites around
Town (i.e., forgotten or buried oil drums) the extent of their presence
is unknown. At present there are only a few dozen known hazardous
waste sites around Town (Figure
14). These vary in size and material from the heavy metals contamination
at the old MIF (Malleable Iron Fittings Co.) site located near the
Town's railroad station to dust (fines) removal from crushed trap
rock at the Tilcon (New Haven Trap Rock) shipping facility on Juniper
Point. Table 7 has a listing of the known point hazardous waste
sites in Town. As one can see, this list is far from being complete.
For example, the database does not list Nutmeg Steel off Elm Street,
an industrial site contaminated with heavy metals and asbestos from
their steel operations over the last half-century or so. In the
future, it is recommended that money be obtained to conduct a full
survey of the Town's brown fields and other contaminated sites and
that the database be upgraded and maintained.
Pesticides/Herbicides
There are no records as to pesticide or herbicide use around Town.
The use of these chemicals are on an individual basis and can vary
from use of a pesticide on rose bushes to broadcast spraying of
these chemicals on golf course fairways (information on amounts
are not available to the public). Many of the present class of chemical
pesticides and herbicides are less persistent than those of years
ago. For example, any land that was farmed (particularly orchards)
during the 1950s and 1960s probably had DDT applied to the soils.
These chemicals are very persistent and can still be detected today.
For more information on pesticides and herbicides, contact municipal,
state or federal agencies directly (see Appendix
V: Contact Information).
FLOOD HAZARDS
Inland
Flood hazard sites are defined here as all areas within the 100
year floodway and the wave action zone along the coast (Figure
15). Flooding in these areas will vary depending on a number
of factors including density of development, function of the storm
water drainage system, maintenance of the storm water drainage system,
tide height during the storm and relative elevations of the drain
and high tide, among others. Although any structure located within
the floodway has the potential for flood damage, there are some
areas where poor drainage design creates chronic problems. For example,
many of the railroad underpasses flood on a regular basis including
the Route 1 underpass and particularly those along Route 146 at
Montowese Street and a smaller pass at the head of Indian Neck Avenue
near the railroad station. One of the most impacted watersheds in
Town is the Mill Creek system (see below). Extensive development
throughout the watershed has created downstream flooding on even
minor storms, particularly when they occur at high tide. This can
often be seen as flooding across Maple Street. Flooding used to
be common behind the High School, however, much of that problem
was mitigated recently with improvements to the grounds and ball
fields.
Figure 15 shows the main bodies of water and the 100-year floodway.
Any structure located within the floodway does have the potential
to flood, although most structures are designed at an elevation
that should minimize the damage during the 100 year storm. Although
Figure 15 also includes the 500-year storm floodway, the Town does
not regulate these events and structures are not required to protect
themselves from damage during these storms. The 500-year floodway
also includes all 100-year floodways and wetland systems down-gradient.
The maps presented here are meant for informational purposes and
cannot be used to judge flooding at any one site. Any individual
wanting to know more about the potential for flooding on their property
should visit Town Hall and study the flood maps on file.
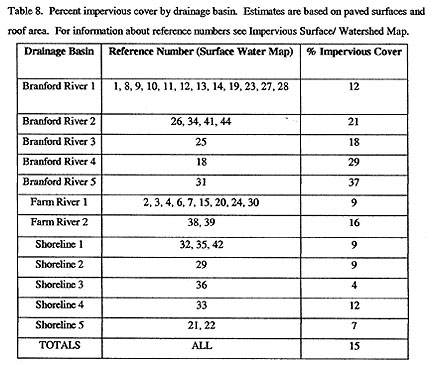
Flood hazards are intensified by development (Table 8). Although
elevation plays a role, the addition of impervious surface to a
watershed increases flows and changes hydrographs for the area.
Thus, a structure that appears to be out of harms way based on elevation
can still experience damage during flood events due to two main
problems; (1) the water cannot drain off of the landscape properly
or (2) it drains so fast from the upper reaches that the downstream
levels of water are artificially driven upward and the flood extends
beyond the known floodway. Figure 16 shows the extent of impervious
surfaces in Town. If we use the Mill Creek basin (Figure
17: Impervious Surfaces Mill Creek) as an example (shading on
Figure 16 and Figure
17), about 28% of the watershed is covered with pavement or
rooftop of some kind. This means that water from that 28% of the
land is almost immediately added to the drainage ways on the landscape.
Channels and culverts that were designed to carry a certain amount
of water over a specific amount of time are now carrying more water
in less amount of time. The result is that flooding is now common
within the watershed, even on smaller storm events that should not
be a problem. Attempts to retain the water onsite are now just being
added to site plans. Walmart has retention under its parking lot
and all new commercial construction in the basin will be required
to provide similar engineering practices. Although the Mill Creek
is just one example, this problem is repeated throughout the area
(i.e., Farm River along the East Haven border).
Coastal
Out along the coast, besides flooding, wave action is also a problem,
particularly during high winds and storms that track northward across
the LIS. This wave action can increase erosion and place strain
on flood control devices that are normally there to protect inland
areas from flooding. The amount of impact wave action will have
on a property will be directly proportional to how open the site
is to the Sound or harbor areas and the elevation of the site above
sea level.
Although the flood maps are able to determine the potential for
flooding, it is important to consider that much of Branford is situated
along the coast. At present, Connecticut (and the rest of the east
coast of the US) is in a period of accelerated sea level rise. Conservative
estimates place the rate of rise at, at least, 6 inches in the next
30 to 50 years. This 6-inch rise in sea level translates to much
more than 6 inches of water throughout the Town. As the sea level
rises, coastal marshes that act as sponges on the landscape, will
begin to disappear since they cannot transgress landward due to
the intensity of development along much of the coast (Orson 1996)
(our present coastal regulations only leave a 25-foot setback for
development and the marsh system will not be able to maintain its
habitat as it rolls closer to people's backyards). The loss of these
natural sponges will allow more water to make its way onto the upland
during a storm. In addition, the increased relative sea levels will
significantly reduce drainage off of the upland (particularly at
high tide) and, when combined with increased amounts of water, will
greatly magnify the impacts of storms on the Town. As sea level
rises, wave action will also move further inland, (rate depends
on slope of the land) and erosion may be experienced in areas that
have never experienced it in the past. Ground water tables will
also be forced upward and storm drains, dry wells and septic systems
that have been designed using today's standards will become less
and less effective. House foundations that are within of a foot
of the present water table can expect to see increased basement
flooding and damage due to high water tables. Unfortunately, sea
level rise is not considered in any of the Town's or State's coastal
or inland regulations and as more development occurs, more problems
will arise in the future.
.
Underground Storage Tanks (UST)
Underground storage tanks (UST) have the potential to cause significant
damage to underground water resources if they begin to fail. Often
times the failure of a UST is not found until a significant pollution
event has occurred. This makes this resource one of the most potentially
harmful problems on a site-to-site basis and one that is important
to the Town.
Unfortunately, the Town does not have or maintain records of the
UST within its borders. When most UST were installed, no record
of their installation or capacity was required. At present only
new UST are permitted and recorded by the Building and Engineering
Department and only those that have been removed are listed with
the Fire Department. Neither department keeps a tally or record
of these USTs except on a file-by-file basis. The budget for this
NRI does not provide funds to sift through the records and tabulate
the USTs in Town. For more information pertaining to specific sites,
contact the Fire Department at (203)488-7266 for UST that have been
removed and the Building and Engineering Department at (203)488-1651
for new installations.
|